Seabornでよく見る色の指定方法
目次
seabornを使うときによくみる色がある。
pairplotなどでhueを指定するとデフォルトでよくこの色になる。

この色を手動で出す方法を調べたのでメモする。
また、カラーパレットやカラーマップを使用するにあたって、細かい部分(カラーバーを後付けする方法や凡例から色を取り出す方法など)のやり方をまとめた。
Sponsored by Google AdSense
やり方
seabornでは基本的にデフォルトでその色になるので、同じことをmatplotlibでやるにはどうやるかといった観点でまとめる。
from sklearn.datasets import load_iris, load_diabetes
from sklearn.decomposition import PCA
import sklearn
import pandas as pd
import matplotlib
import matplotlib.collections
import matplotlib.cm
import matplotlib.colors
import matplotlib.pyplot as plt
import seaborn as sns
バージョン
for package in [sklearn, matplotlib, sns]:
    print(f"{package.__name__}: {package.__version__}")
sklearn: 1.1.1
matplotlib: 3.5.2
seaborn: 0.11.2
離散値の場合
まず、あやめのデータセットを使って離散値での使い方を示す。
iris = load_iris()
X = pd.DataFrame(iris.data, columns=iris.feature_names)
y = pd.Series(iris.target, name="target")
display(X.head(), y.to_frame().head())
| sepal length (cm) | sepal width (cm) | petal length (cm) | petal width (cm) | |
|---|---|---|---|---|
| 0 | 5.1 | 3.5 | 1.4 | 0.2 |
| 1 | 4.9 | 3.0 | 1.4 | 0.2 |
| 2 | 4.7 | 3.2 | 1.3 | 0.2 |
| 3 | 4.6 | 3.1 | 1.5 | 0.2 |
| 4 | 5.0 | 3.6 | 1.4 | 0.2 |
| target | |
|---|---|
| 0 | 0 |
| 1 | 0 |
| 2 | 0 |
| 3 | 0 |
| 4 | 0 |
PCAで2次元に圧縮したものを品種ごとに色を分けてプロットする場面を考える。
X_pca = PCA(n_components=2).fit_transform(X)
seabornのとき
fig, ax = plt.subplots(facecolor="white")
sns.scatterplot(
    x=X_pca[:, 0],
    y=X_pca[:, 1],
    hue=y,
    ax=ax,
    # cmap=sns.cubehelix_palette(as_cmap=True), # 現在のバージョンでは明示しなくてもデフォルトでcubehelix_paletteが適用される
)
fig.tight_layout()
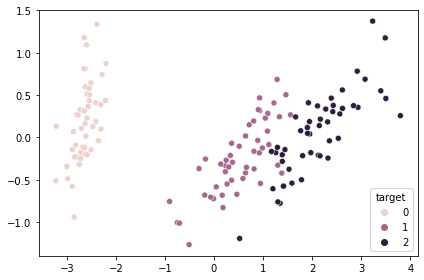
とても簡単。
ちなみに、それぞれのプロットの色を取り出す方法は以下。
for path_collection, label in zip(*ax.get_legend_handles_labels()):
    path_collection: matplotlib.collections.PathCollection
    label: str

    # labelとその色を表示
    print(label, path_collection.get_facecolor())
0 [[0.93126922 0.82019218 0.7971481  1.        ]]
1 [[0.66265275 0.40279894 0.5599294  1.        ]]
2 [[0.17508656 0.11840023 0.24215989 1.        ]]
matplotlibのとき
fig, ax = plt.subplots(facecolor="white")
mappable = ax.scatter(
    x=X_pca[:, 0], y=X_pca[:, 1], c=y, cmap=sns.cubehelix_palette(as_cmap=True)
)
ax.legend(*mappable.legend_elements(), title="target")
fig.tight_layout()
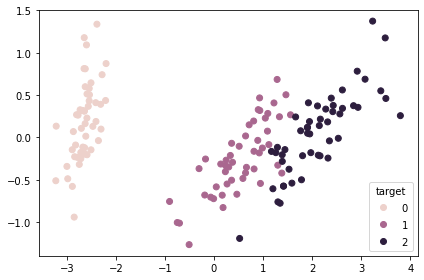
連続値の場合
diabetes = load_diabetes()
X = pd.DataFrame(diabetes.data, columns=diabetes.feature_names)
y = pd.Series(diabetes.target, name="target")
display(X.head(), y.to_frame().head())
| age | sex | bmi | bp | s1 | s2 | s3 | s4 | s5 | s6 | |
|---|---|---|---|---|---|---|---|---|---|---|
| 0 | 0.038076 | 0.050680 | 0.061696 | 0.021872 | -0.044223 | -0.034821 | -0.043401 | -0.002592 | 0.019907 | -0.017646 |
| 1 | -0.001882 | -0.044642 | -0.051474 | -0.026328 | -0.008449 | -0.019163 | 0.074412 | -0.039493 | -0.068332 | -0.092204 |
| 2 | 0.085299 | 0.050680 | 0.044451 | -0.005670 | -0.045599 | -0.034194 | -0.032356 | -0.002592 | 0.002861 | -0.025930 |
| 3 | -0.089063 | -0.044642 | -0.011595 | -0.036656 | 0.012191 | 0.024991 | -0.036038 | 0.034309 | 0.022688 | -0.009362 |
| 4 | 0.005383 | -0.044642 | -0.036385 | 0.021872 | 0.003935 | 0.015596 | 0.008142 | -0.002592 | -0.031988 | -0.046641 |
| target | |
|---|---|
| 0 | 151.0 |
| 1 | 75.0 |
| 2 | 141.0 |
| 3 | 206.0 |
| 4 | 135.0 |
離散値の場合と同様にPCAで2次元に圧縮した結果を可視化する。
X_pca = PCA(n_components=2).fit_transform(X)
seabornのとき
fig, ax = plt.subplots(facecolor="white")
ax = sns.scatterplot(
    x=X_pca[:, 0],
    y=X_pca[:, 1],
    hue=y,
    ax=ax,
    legend=False,
    # cmap=sns.cubehelix_palette(as_cmap=True), # 現在のバージョンでは明示しなくてもデフォルトでcubehelix_paletteが適用される
)
# あとからカラーバーをつける方法
norm = matplotlib.colors.Normalize(y.min(), y.max())  # 現時点では`plt.Normalize`でも可
sm = matplotlib.cm.ScalarMappable(
    cmap=sns.cubehelix_palette(as_cmap=True), norm=norm
)
sm.set_array([])

fig.colorbar(sm, ax=ax, label="target")
fig.tight_layout()
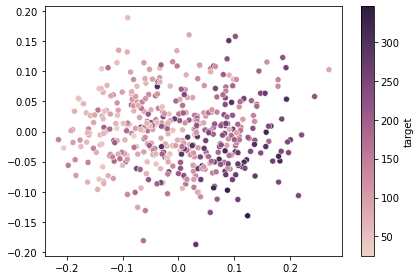
matplotlibのとき
fig, ax = plt.subplots(facecolor="white")
mappable = ax.scatter(
    x=X_pca[:, 0], y=X_pca[:, 1], c=y, cmap=sns.cubehelix_palette(as_cmap=True)
)
fig.colorbar(mappable, ax=ax, label="target")
fig.tight_layout()
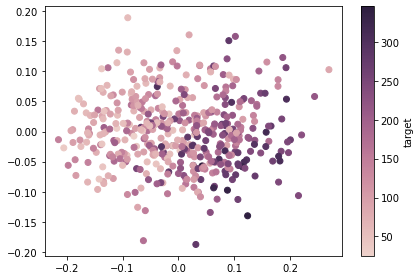
ちなみに
冒頭に見せた色の見本のようなものは以下のコードで生成できる。
sns.palplot(sns.cubehelix_palette(8))
# 保存する場合
# plt.savefig("cubehelix_palette.png")

他の色でも結構同じことができる。
sns.palplot(sns.color_palette("viridis", 8))
# 保存する場合
# plt.savefig("viridis_palette.png")

この方法を使うと連続値向けのカラーマップを簡単に離散化できる。
as_cmapを引数として与えてあげればカラーマップオブジェクトとしても使えるので上位互換だと思っている。
カラーマップで指定できる名前の一覧を取得
print(f"type is {type(matplotlib.cm._gen_cmap_registry())}")

for name, cmap in matplotlib.cm._gen_cmap_registry().items():
    print("key: ", name)
    print("value: ", cmap)
    break
type is <class 'dict'>
key:  magma
value:  <matplotlib.colors.ListedColormap object at 0x151209b80>
上記の関数で帰ってきた辞書のkeyだけを取り出せばカラーマップで指定できる名前の一覧を取得できる。
もっと簡便的には、エラーメッセージに教えてもらうという方法がある。
_ = plt.scatter([], [], c=[], cmap="XX")
---------------------------------------------------------------------------

ValueError                                Traceback (most recent call last)

/Users/yu9824/article/seaborn-palette/2022-02-14-seaborn-palette.ipynb セル 33 in <cell line: 1>()
----> <a href='vscode-notebook-cell:/Users/yu9824/article/seaborn-palette/2022-02-14-seaborn-palette.ipynb#X42sZmlsZQ%3D%3D?line=0'>1</a> _ = plt.scatter([], [], c=[], cmap="XX")


File ~/miniforge3/envs/py39/lib/python3.9/site-packages/matplotlib/pyplot.py:2819, in scatter(x, y, s, c, marker, cmap, norm, vmin, vmax, alpha, linewidths, edgecolors, plotnonfinite, data, **kwargs)
   2814 @_copy_docstring_and_deprecators(Axes.scatter)
   2815 def scatter(
   2816         x, y, s=None, c=None, marker=None, cmap=None, norm=None,
   2817         vmin=None, vmax=None, alpha=None, linewidths=None, *,
   2818         edgecolors=None, plotnonfinite=False, data=None, **kwargs):
-> 2819     __ret = gca().scatter(
   2820         x, y, s=s, c=c, marker=marker, cmap=cmap, norm=norm,
   2821         vmin=vmin, vmax=vmax, alpha=alpha, linewidths=linewidths,
   2822         edgecolors=edgecolors, plotnonfinite=plotnonfinite,
   2823         **({"data": data} if data is not None else {}), **kwargs)
   2824     sci(__ret)
   2825     return __ret


File ~/miniforge3/envs/py39/lib/python3.9/site-packages/matplotlib/__init__.py:1412, in _preprocess_data.<locals>.inner(ax, data, *args, **kwargs)
   1409 @functools.wraps(func)
   1410 def inner(ax, *args, data=None, **kwargs):
   1411     if data is None:
-> 1412         return func(ax, *map(sanitize_sequence, args), **kwargs)
   1414     bound = new_sig.bind(ax, *args, **kwargs)
   1415     auto_label = (bound.arguments.get(label_namer)
   1416                   or bound.kwargs.get(label_namer))


File ~/miniforge3/envs/py39/lib/python3.9/site-packages/matplotlib/axes/_axes.py:4465, in Axes.scatter(self, x, y, s, c, marker, cmap, norm, vmin, vmax, alpha, linewidths, edgecolors, plotnonfinite, **kwargs)
   4463 if colors is None:
   4464     collection.set_array(c)
-> 4465     collection.set_cmap(cmap)
   4466     collection.set_norm(norm)
   4467     collection._scale_norm(norm, vmin, vmax)


File ~/miniforge3/envs/py39/lib/python3.9/site-packages/matplotlib/cm.py:546, in ScalarMappable.set_cmap(self, cmap)
    538 """
    539 Set the colormap for luminance data.
    540
   (...)
    543 cmap : `.Colormap` or str or None
    544 """
    545 in_init = self.cmap is None
--> 546 cmap = get_cmap(cmap)
    547 self.cmap = cmap
    548 if not in_init:


File ~/miniforge3/envs/py39/lib/python3.9/site-packages/matplotlib/cm.py:286, in get_cmap(name, lut)
    284 if isinstance(name, colors.Colormap):
    285     return name
--> 286 _api.check_in_list(sorted(_cmap_registry), name=name)
    287 if lut is None:
    288     return _cmap_registry[name]


File ~/miniforge3/envs/py39/lib/python3.9/site-packages/matplotlib/_api/__init__.py:129, in check_in_list(_values, _print_supported_values, **kwargs)
    127 if _print_supported_values:
    128     msg += f"; supported values are {', '.join(map(repr, values))}"
--> 129 raise ValueError(msg)


ValueError: 'XX' is not a valid value for name; supported values are 'Accent', 'Accent_r', 'Blues', 'Blues_r', 'BrBG', 'BrBG_r', 'BuGn', 'BuGn_r', 'BuPu', 'BuPu_r', 'CMRmap', 'CMRmap_r', 'Dark2', 'Dark2_r', 'GnBu', 'GnBu_r', 'Greens', 'Greens_r', 'Greys', 'Greys_r', 'OrRd', 'OrRd_r', 'Oranges', 'Oranges_r', 'PRGn', 'PRGn_r', 'Paired', 'Paired_r', 'Pastel1', 'Pastel1_r', 'Pastel2', 'Pastel2_r', 'PiYG', 'PiYG_r', 'PuBu', 'PuBuGn', 'PuBuGn_r', 'PuBu_r', 'PuOr', 'PuOr_r', 'PuRd', 'PuRd_r', 'Purples', 'Purples_r', 'RdBu', 'RdBu_r', 'RdGy', 'RdGy_r', 'RdPu', 'RdPu_r', 'RdYlBu', 'RdYlBu_r', 'RdYlGn', 'RdYlGn_r', 'Reds', 'Reds_r', 'Set1', 'Set1_r', 'Set2', 'Set2_r', 'Set3', 'Set3_r', 'Spectral', 'Spectral_r', 'Wistia', 'Wistia_r', 'YlGn', 'YlGnBu', 'YlGnBu_r', 'YlGn_r', 'YlOrBr', 'YlOrBr_r', 'YlOrRd', 'YlOrRd_r', 'afmhot', 'afmhot_r', 'autumn', 'autumn_r', 'binary', 'binary_r', 'bone', 'bone_r', 'brg', 'brg_r', 'bwr', 'bwr_r', 'cividis', 'cividis_r', 'cool', 'cool_r', 'coolwarm', 'coolwarm_r', 'copper', 'copper_r', 'crest', 'crest_r', 'cubehelix', 'cubehelix_r', 'flag', 'flag_r', 'flare', 'flare_r', 'gist_earth', 'gist_earth_r', 'gist_gray', 'gist_gray_r', 'gist_heat', 'gist_heat_r', 'gist_ncar', 'gist_ncar_r', 'gist_rainbow', 'gist_rainbow_r', 'gist_stern', 'gist_stern_r', 'gist_yarg', 'gist_yarg_r', 'gnuplot', 'gnuplot2', 'gnuplot2_r', 'gnuplot_r', 'gray', 'gray_r', 'hot', 'hot_r', 'hsv', 'hsv_r', 'icefire', 'icefire_r', 'inferno', 'inferno_r', 'jet', 'jet_r', 'magma', 'magma_r', 'mako', 'mako_r', 'nipy_spectral', 'nipy_spectral_r', 'ocean', 'ocean_r', 'pink', 'pink_r', 'plasma', 'plasma_r', 'prism', 'prism_r', 'rainbow', 'rainbow_r', 'rocket', 'rocket_r', 'seismic', 'seismic_r', 'spring', 'spring_r', 'summer', 'summer_r', 'tab10', 'tab10_r', 'tab20', 'tab20_r', 'tab20b', 'tab20b_r', 'tab20c', 'tab20c_r', 'terrain', 'terrain_r', 'turbo', 'turbo_r', 'twilight', 'twilight_r', 'twilight_shifted', 'twilight_shifted_r', 'viridis', 'viridis_r', 'vlag', 'vlag_r', 'winter', 'winter_r'
参考
カラーマップについて
選べるカラーマップの変数は以下。
カラーパレットについて
まとめ
sns.cubehelix_paletteを使用することで取得できる。
- カラーマップを返してほしいとき
sns.cubehelix_palette(as_cmap=True)
- $N$色のリストを返してほしいとき
sns.cubehelix_palette(N)
コメント
ほとんど同じグラフをmatplotlibとseabornで描き分けることで普段は使わない機能を使うことができ、とても勉強になった。
色がおしゃれだと個人的には思うので積極的に使っていきたい。


