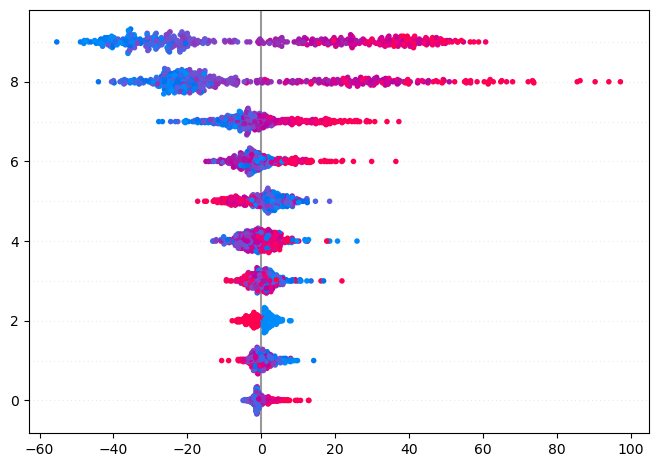
shap.summary_plotでカラーバーが表示できない
shapで解析した結果を可視化しようとした際、よくわからないmatplotlibのエラーに遭遇した。
調べても出てこず、色々試した結果うまくいったのでエラーコードと共に対処法を示す。
バグなのか仕様変更なのかはわかっていない。
Sponsored by Google AdSense
状況
以下に簡単な状況の再現を行った。
当方M1 Macであるが、これがアーキテクチャ/OSに依存する問題なのかはわかっていない。
import sys

import sklearn
from sklearn.datasets import load_diabetes
from sklearn.ensemble import RandomForestRegressor
from sklearn.feature_selection import VarianceThreshold

import matplotlib as mpl
import matplotlib.pyplot as plt

import shap
バージョン
print("Python version: {}".format(sys.version))
print("Matplotlib version: {}".format(mpl.__version__))
print("SHAP version: {}".format(shap.__version__))
print("scikit-learn version: {}".format(sklearn.__version__))
Python version: 3.8.13 | packaged by conda-forge | (default, Mar 25 2022, 06:05:16)
[Clang 12.0.1 ]
Matplotlib version: 3.6.0
SHAP version: 0.41.0
scikit-learn version: 1.1.2
データセットの準備
data = load_diabetes(as_frame=True)
X, y = data.data, data.target
display(X.head(), y.head())
| age | sex | bmi | bp | s1 | s2 | s3 | s4 | s5 | s6 | |
|---|---|---|---|---|---|---|---|---|---|---|
| 0 | 0.038076 | 0.050680 | 0.061696 | 0.021872 | -0.044223 | -0.034821 | -0.043401 | -0.002592 | 0.019907 | -0.017646 |
| 1 | -0.001882 | -0.044642 | -0.051474 | -0.026328 | -0.008449 | -0.019163 | 0.074412 | -0.039493 | -0.068332 | -0.092204 |
| 2 | 0.085299 | 0.050680 | 0.044451 | -0.005670 | -0.045599 | -0.034194 | -0.032356 | -0.002592 | 0.002861 | -0.025930 |
| 3 | -0.089063 | -0.044642 | -0.011595 | -0.036656 | 0.012191 | 0.024991 | -0.036038 | 0.034309 | 0.022688 | -0.009362 |
| 4 | 0.005383 | -0.044642 | -0.036385 | 0.021872 | 0.003935 | 0.015596 | 0.008142 | -0.002592 | -0.031988 | -0.046641 |
0    151.0
1     75.0
2    141.0
3    206.0
4    135.0
Name: target, dtype: float64
学習
rf = RandomForestRegressor(random_state=334, n_jobs=-1).fit(X, y)
shap valueの計算
explainer = shap.TreeExplainer(rf)
shap_values = explainer.shap_values(X)
summary_plotの作成
shap.summary_plot(shap_values, X)
No data for colormapping provided via 'c'. Parameters 'vmin', 'vmax' will be ignored


---------------------------------------------------------------------------

ValueError                                Traceback (most recent call last)

Cell In [6], line 1
----> 1 shap.summary_plot(shap_values, X)


File ~/miniforge3/envs/test/lib/python3.8/site-packages/shap/plots/_beeswarm.py:865, in summary_legacy(shap_values, features, feature_names, max_display, plot_type, color, axis_color, title, alpha, show, sort, color_bar, plot_size, layered_violin_max_num_bins, class_names, class_inds, color_bar_label, cmap, auto_size_plot, use_log_scale)
    863 m = cm.ScalarMappable(cmap=cmap if plot_type != "layered_violin" else pl.get_cmap(color))
    864 m.set_array([0, 1])
--> 865 cb = pl.colorbar(m, ticks=[0, 1], aspect=80)
    866 cb.set_ticklabels([labels['FEATURE_VALUE_LOW'], labels['FEATURE_VALUE_HIGH']])
    867 cb.set_label(color_bar_label, size=12, labelpad=0)


File ~/miniforge3/envs/test/lib/python3.8/site-packages/matplotlib/pyplot.py:2053, in colorbar(mappable, cax, ax, **kwargs)
   2048     if mappable is None:
   2049         raise RuntimeError('No mappable was found to use for colorbar '
   2050                            'creation. First define a mappable such as '
   2051                            'an image (with imshow) or a contour set ('
   2052                            'with contourf).')
-> 2053 ret = gcf().colorbar(mappable, cax=cax, ax=ax, **kwargs)
   2054 return ret


File ~/miniforge3/envs/test/lib/python3.8/site-packages/matplotlib/figure.py:1256, in FigureBase.colorbar(self, mappable, cax, ax, use_gridspec, **kwargs)
   1254 if cax is None:
   1255     if ax is None:
-> 1256         raise ValueError(
   1257             'Unable to determine Axes to steal space for Colorbar. '
   1258             'Either provide the *cax* argument to use as the Axes for '
   1259             'the Colorbar, provide the *ax* argument to steal space '
   1260             'from it, or add *mappable* to an Axes.')
   1261     current_ax = self.gca()
   1262     userax = False


ValueError: Unable to determine Axes to steal space for Colorbar. Either provide the *cax* argument to use as the Axes for the Colorbar, provide the *ax* argument to steal space from it, or add *mappable* to an Axes.

こんな感じのエラーに遭遇した。
画像は生成されているが、カラーバーが表示されていない。
エラーメッセージを読めばわかるが、colorbarにまつわるエラーなのでcolor_bar=Falseをsummary_plotの引数に入れるとエラーにはならなくなる(当然カラーバーが表示されない)。
調べたところ
これはmatplotlib 3.6.0において起こる問題のよう。
shapにおいてではないが、issueに同様の報告があった。
今日(2022/10/05)時点ではopenなのでまだ対処できていないという状況だろう。
対処法
3.6.0ではなく、別のバージョンのmatplotlibを使う。
ちなみに上記のコードはmatplotlib==3.5.2において動作を確認した。
コメント
issueで色々やり取りされているので、おそらく修正されるだろうと期待している。


