optunaで多目的最適化
ある材料の物性を予測して最適化したい場合、物性を一つだけ予測して済むケースは少ない。
たとえば簡単な例では、ある性能を高めたいけれど、値段が高くてはお客様に買ってもらえないので、価格を抑えたいケースを考える。このとき、価格とその材料の性能の二種類の最適化したい対象が存在し、両方ができる限り最適になるようにしていく、いわば、パレート解の探索を行う。
ここでは、ハイパーパラメータの探索などに用いられるブラックボックス最適化ライブラリoptunaで多目的最適化を行い、パレート解を列挙する方法や、それを図示する方法について記す。
環境
python==3.9.13
optuna==2.10.0
やり方
多目的最適化
モジュールのインポート
import matplotlib.pyplot as plt
import optuna
import warnings
再現性を確保するために、seed値を固定
SEED = 334
最小化したい関数を定義する。ここでは、わかりやすく二次関数とする。
v2.9.0のリリースで用いられた例をそのまま用いる。
def objective(trial:optuna.trial.Trial) -> tuple[float]:
    x = trial.suggest_float("x", 0, 5)
    y = trial.suggest_float("y", 0, 3)

    v0 = 4 * x ** 2 + 4 * y ** 2
    v1 = (x - 5) ** 2 + (y - 5) ** 2

    return v0, v1
TPESampler
単目的最適化でも多目的最適化でもoptuna.samplers.TPESamplerを使う。
以前は多目的最適化のときはoptuna.samplers.MOTPESamplerを使うことになっていたが、optuna.samplers.TPESamplerにすでに機能移行は終わっているらしく、現在は非推奨になっている。
sampler_motpe = optuna.samplers.MOTPESampler(seed=SEED)
/var/folders/81/n__nnfgd0zbf9m67d0jvmx_c0000gn/T/ipykernel_16032/3685325591.py:1: FutureWarning: MOTPESampler has been deprecated in v2.9.0. This feature will be removed in v4.0.0. See https://github.com/optuna/optuna/releases/tag/v2.9.0.
  sampler_motpe = optuna.samplers.MOTPESampler(seed=SEED)
v4.0.0において削除の予定らしい。
optuna.logging.disable_default_handler()    # ログを非表示
sampler_tpe = optuna.samplers.TPESampler(seed=SEED)
study_tpe = optuna.create_study(directions=['minimize', 'minimize'], sampler=sampler_tpe)
study_tpe.optimize(objective, n_trials=100)
NSGAIISampler
遺伝的アルゴリズムを多目的最適化に拡張したもの。
詳しくは論文を参照。
- Deb, K., Pratap, A., Agarwal, S., & Meyarivan, T. A. M. T. (2002). A fast and elitist multiobjective genetic algorithm: NSGA-II. IEEE transactions on evolutionary computation, 6(2), 182-197. doi: 10.1109/4235.996017
もしくは解説されているサイトを参照。
sampler_nsgaii = optuna.samplers.NSGAIISampler(seed=SEED)
study_nsgaii = optuna.create_study(directions=['minimize', 'minimize'], sampler=sampler_nsgaii)
study_nsgaii.optimize(objective, n_trials=100)
TPESamplerとNSGAIISamplerのどちらの結果を使っても以下は同じコードで書けるので、代表してTPESamplerの結果を使用する。
パレート解の取得
単目的最適化のときには、study.best_trialで一番よかったときのTrialが取得できるが、多目的最適化の場合はstudy.best_trialsでパレート解を持つTrialのリストが取得できる。
使い方としては、
たとえば、v0, v1の値を求める。
for trial in study_tpe.best_trials:
    x = trial.params['x']
    y = trial.params['y']
    if (x < 1 and y < 1) or (4 < x and 2 < y):
        print(f'x={x:.2f}, y={y:.2f}, v0={trial.values[0]:.2f}, v1={trial.values[1]:.2f}')
x=0.62, y=0.51, v0=2.59, v1=39.32
x=0.27, y=0.64, v0=1.93, v1=41.38
x=0.58, y=0.69, v0=3.25, v1=38.11
x=0.38, y=0.67, v0=2.40, v1=40.05
x=0.60, y=0.82, v0=4.15, v1=36.82
x=0.83, y=0.88, v0=5.89, v1=34.32
x=4.00, y=2.91, v0=98.03, v1=5.35
x=0.82, y=0.79, v0=5.13, v1=35.27
可視化
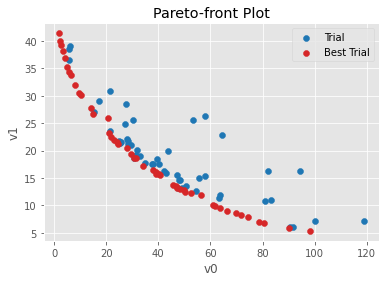
plotlyでマウスで触れるグラフを作ることも、matplotlibで静的なグラフを作ることもできる。それぞれ以下の通り。
# matplotlib
optuna.visualization.matplotlib.plot_pareto_front(study_tpe, target_names=[f'v{i}' for i in range(2)])

# plotly
optuna.visualization.plot_pareto_front(study_tpe, target_names=[f'v{i}' for i in range(2)])
/var/folders/81/n__nnfgd0zbf9m67d0jvmx_c0000gn/T/ipykernel_16032/2481105479.py:2: ExperimentalWarning: plot_pareto_front is experimental (supported from v2.8.0). The interface can change in the future.
  optuna.visualization.matplotlib.plot_pareto_front(study_tpe, target_names=[f'v{i}' for i in range(2)])
/var/folders/81/n__nnfgd0zbf9m67d0jvmx_c0000gn/T/ipykernel_16032/2481105479.py:5: ExperimentalWarning: plot_pareto_front is experimental (supported from v2.4.0). The interface can change in the future.
  optuna.visualization.plot_pareto_front(study_tpe, target_names=[f'v{i}' for i in range(2)])

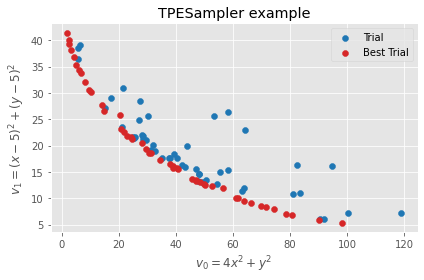
ちなみに、後から色々変えたい場合は、figureやaxを取得し編集する。
# ignore optuna's experimental warnings
warnings.filterwarnings('ignore', category=optuna.exceptions.ExperimentalWarning)

ax = optuna.visualization.matplotlib.plot_pareto_front(study_tpe, target_names=[f'v{i}' for i in range(2)])

fig = ax.figure

# title
ax.set_title('TPESampler example')

# labels
ax.set_xlabel('$v_0=4x^2+y^2$')
ax.set_ylabel('$v_1=(x-5)^2+(y-5)^2$')

fig.tight_layout()

plt.gca().clear()
plt.close()
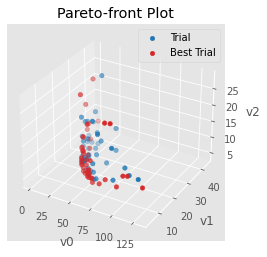
ちなみに目的変数が3つの場合は三次元グラフを作ってくれる。
def objective_3d(trial:optuna.trial.Trial) -> tuple[float]:
    x = trial.suggest_float("x", 0, 5)
    y = trial.suggest_float("y", 0, 3)
    z = trial.suggest_float("z", 0, 3)

    v0 = 4 * x ** 2 + 4 * y ** 2
    v1 = (x - 5) ** 2 + (y - 5) ** 2
    v2 = (x - 2) ** 2 + (z - 5) ** 2

    return v0, v1, v2

study_3d = optuna.create_study(sampler=optuna.samplers.TPESampler(seed=SEED), directions=['minimize']*3)
study_3d.optimize(objective_3d, n_trials=100)
ax = optuna.visualization.matplotlib.plot_pareto_front(study_3d, target_names=[f'v{i}' for i in range(3)])

逆に3つのうち2つ、みたいなことがしたいときは、さっきやったみたいにパレート解を取得して、自力で描けばできる。
import matplotlib.animation as animation

fig, ax = plt.subplots(facecolor='w')
ims = []
values_best_trials_ = {
    'v0': [],
    'v1': [],
}
values_trials_ = {
    'v0': [],
    'v1': [],
}
for trial in study_3d.trials:
    v0, v1 = trial.values[0], trial.values[1]
    if trial in study_3d.best_trials:
        values_best_trials_['v0'].append(v0)
        values_best_trials_['v1'].append(v1)
    else:
        values_trials_['v0'].append(v0)
        values_trials_['v1'].append(v1)

    im_best_trial = ax.scatter(values_best_trials_['v0'], values_best_trials_['v1'], c='C0', label='Best Trial', zorder=1.5)    # Best Trialが上に来るようにzorderを1.5にしている
    im_trial = ax.scatter(values_trials_['v0'], values_trials_['v1'], c='C1', label='Trial')

    ims.append([im_trial, im_best_trial])

ax.legend(handles=[im_best_trial, im_trial])

ax.set_title('Pareto-front Plot')
ax.set_xlabel('v0')
ax.set_ylabel('v1')

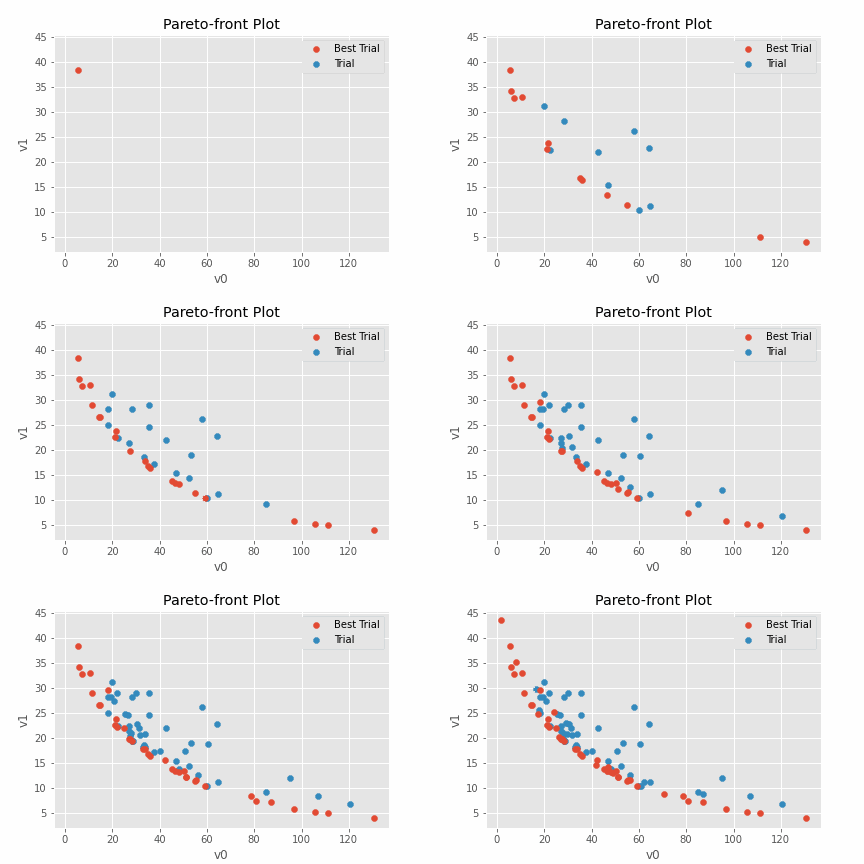
ani = animation.ArtistAnimation(fig, ims, interval=100)

ani.save('ani.gif', writer='pillow')
plt.close()

ついでにアニメーションでパレート面を描画するのも実装してみた。
参考
- トレードオフの関係にある解を一度に求めるOptunaで多目的最適化するための「NSGA-II」と「MOTPE」
- NSGAIIとMOTPEどっちがいいの、という話をしている。多目的最適化とは、パレート解とは、といったところも丁寧に説明されている。


